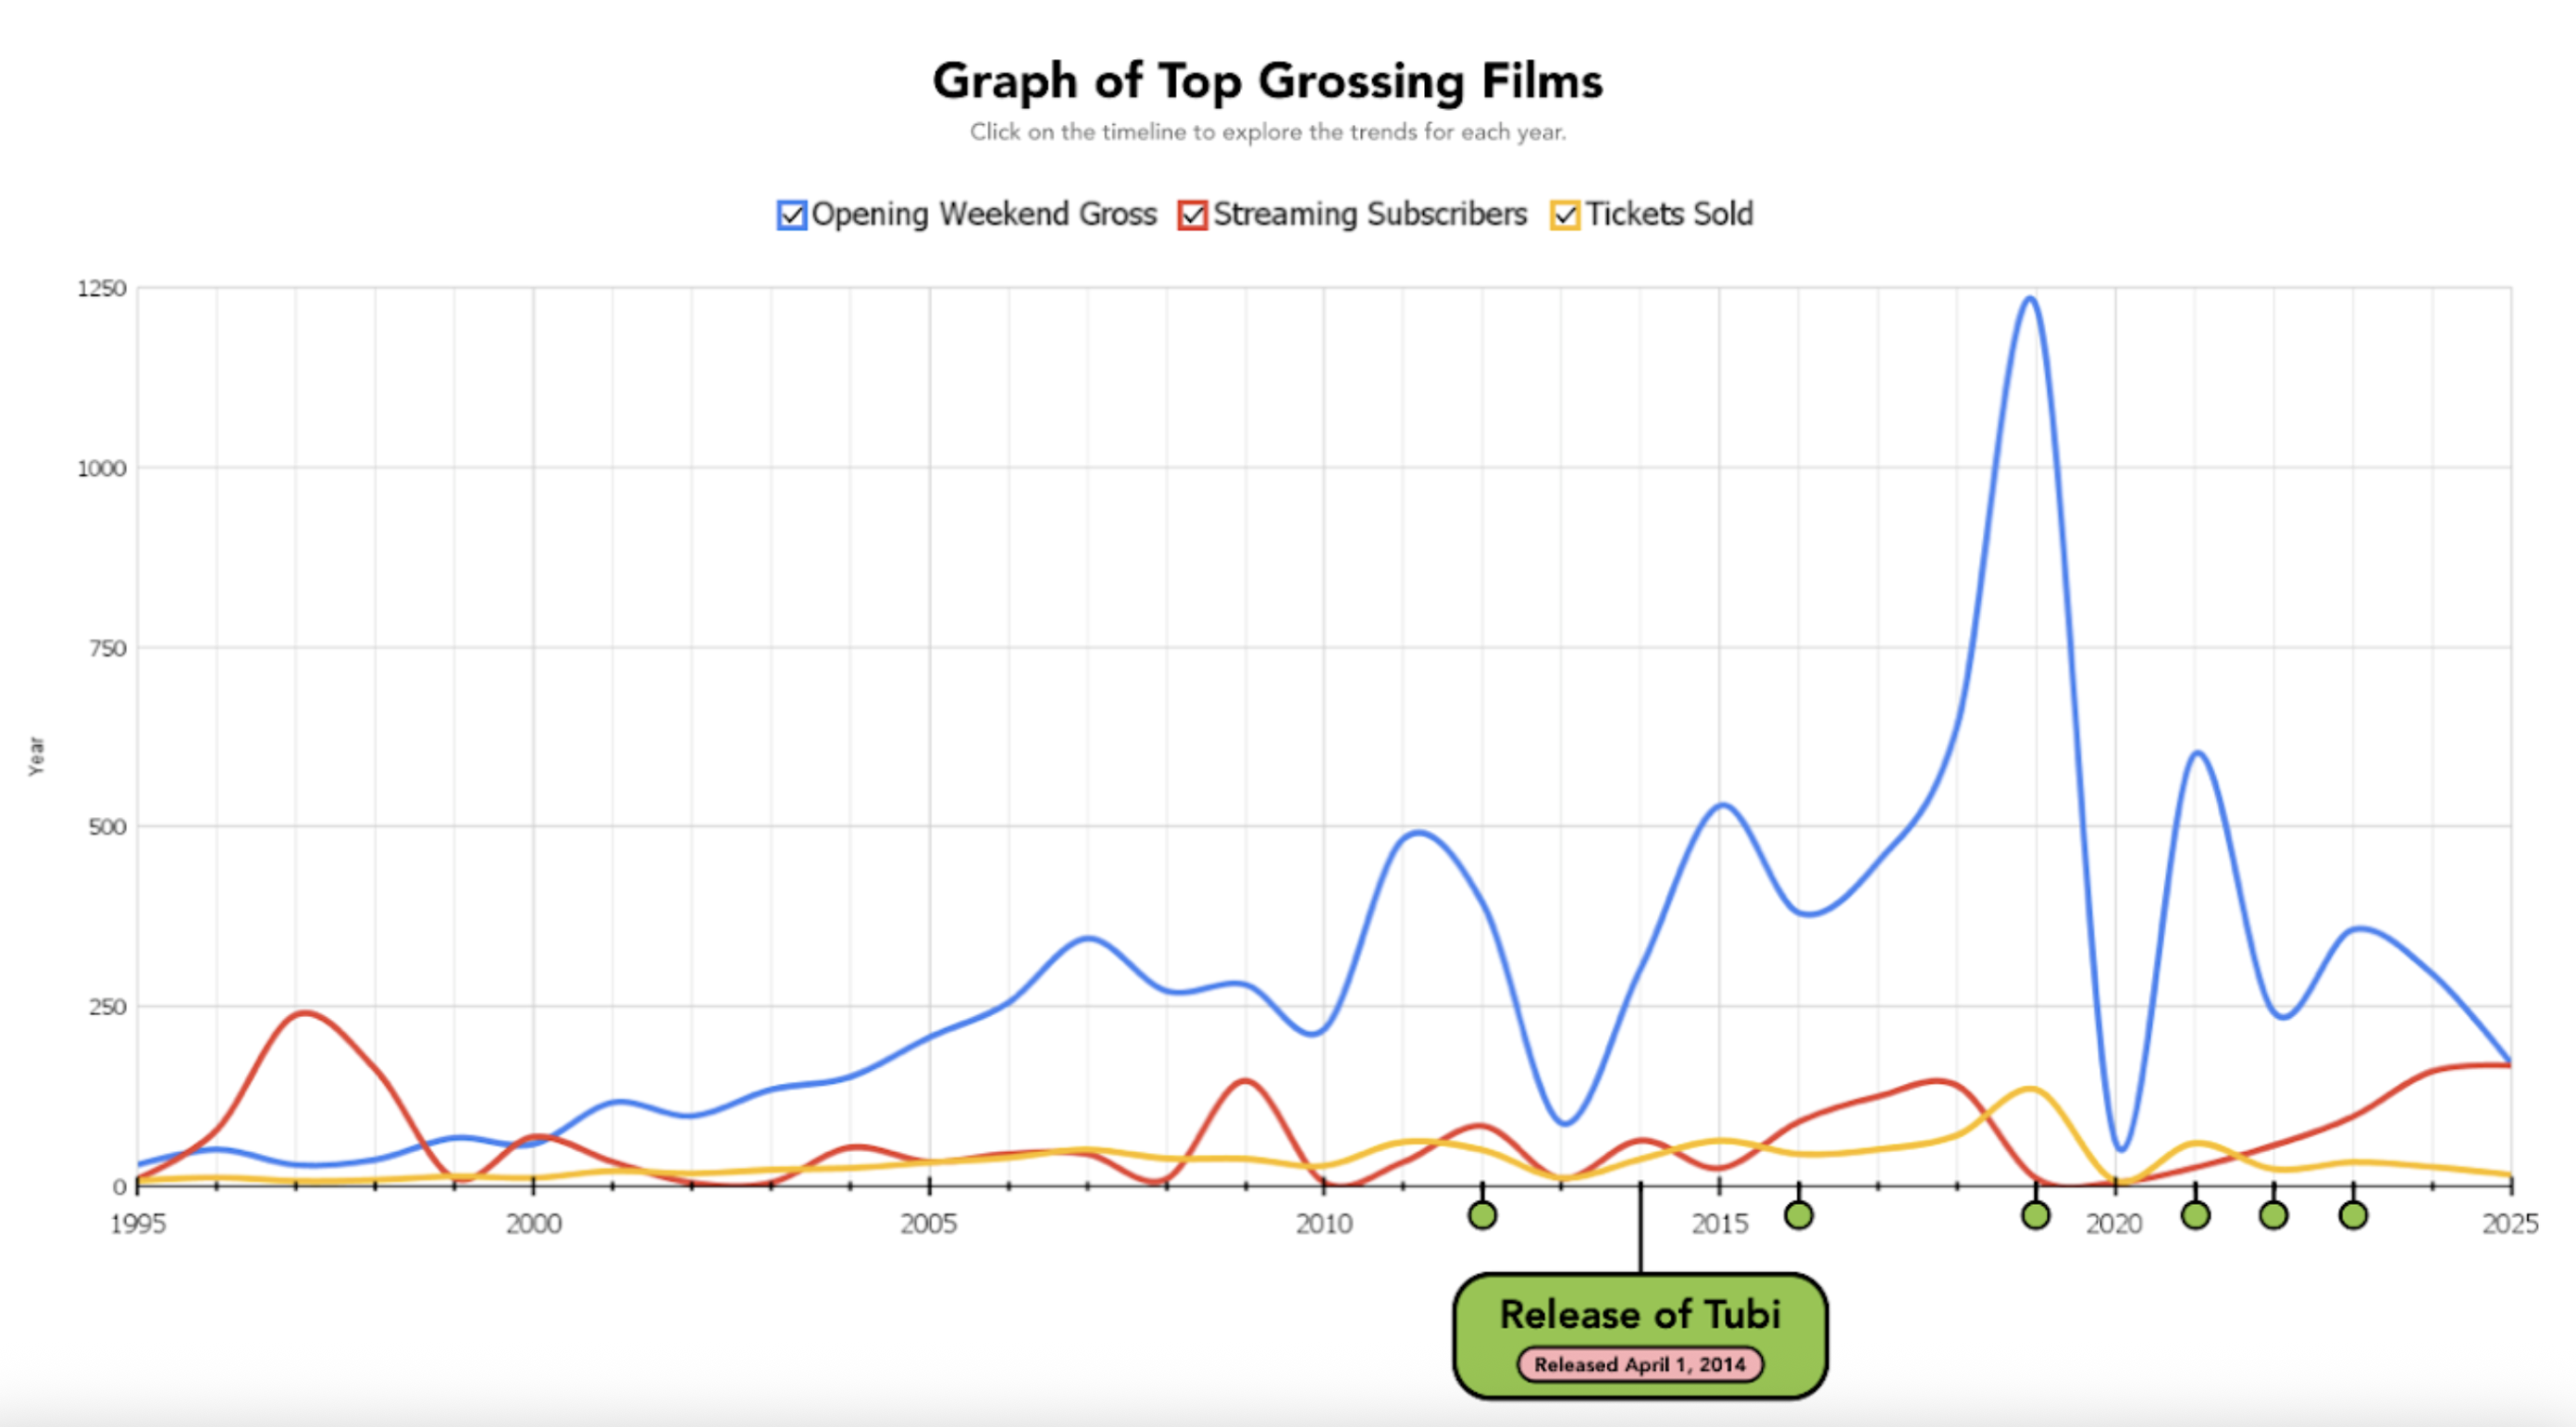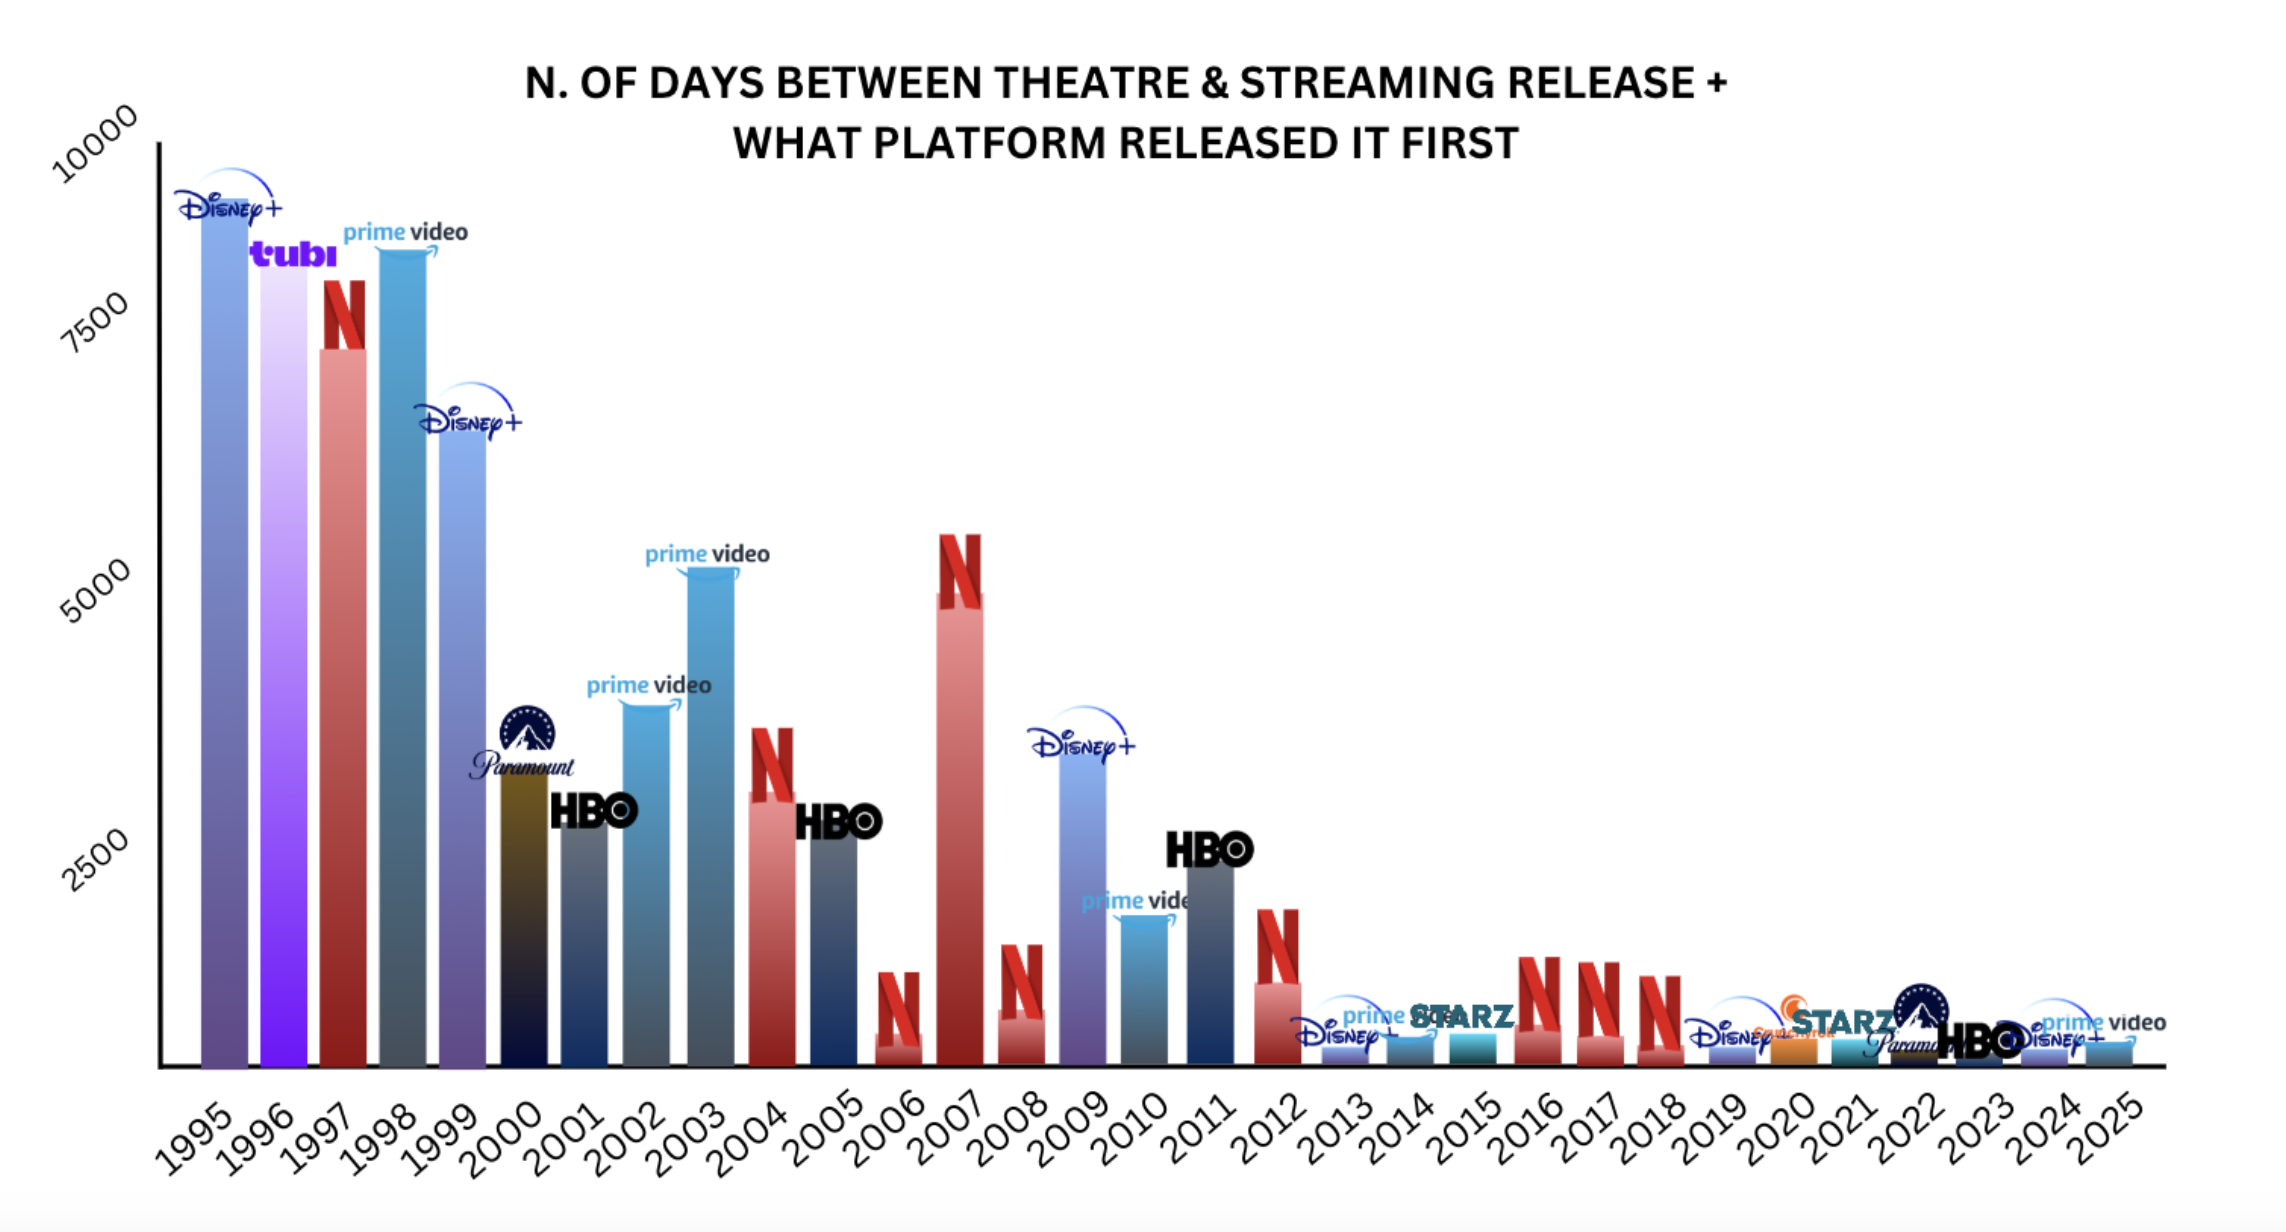
Mission Statement: This project focuses on creating an interactive timeline-based visualization that explores how global events (e.g. COVID-19) have influenced film popularity, streaming growth, and box office trends. By using clear formulas (e.g., box office gross / average ticket price = estimated viewers) and visual markers (milestones, icons), we aim to challenge common headlines about the "most watched" films, which often conflate financial success with viewership impact. This project also plans to investigate the correlation between the rise in streaming subscriptions and box office ticket sales, analyzing whether the two platforms compete, complement, or influence each other. Our goal is to address gaps in existing visualizations, which mainly lack transparency and interactivity, by combining creative design with clear, meaningful data.
Key Goals
Resources
Summary: The Entertainment Strategy Guy writes about data supporting box-office release as opposed to films being immediately released on streaming platforms. This article contextualizes how the film industry used to work as opposed to present day with supporting data: "Historically, films went through a series of "windows,"... starting with theaters, then going to home entertainment, they to pay cable, then to regular broadcast TV and cable. Nowadays, streaming is concurrent with pay cable." This article also shows data visualizations of how these trends have evolved overtime given current events and technological developments.
Summary: Written by Sophie Loesberg, this article presents a student-based coding project for data visualization in the streaming space comparing success between several popular streaming platforms. This project's main goal was to "determine which streaming service has a movie collection with the highest average IMDb rating and which years had the highest rated movies... In conclusion, Disney+ has the highest average IMDb rating at 6.4413854351687 out of 10 among the movies included on their streaming service."
Summary: This article explores the hypothesis: Is video streaming hurting box office revenue at US theatres? This source acknowledges the limited coverage of steaming on traditional media platforms and uses Australia as a comparison group (given shared language, colonial roots, cultural traditions, religious landscapes, and high living standards), with Netflix being introduced to Australia only in 2015 vs 2007 in the US. They focused on large-reach films (shown in 600 theaters on opening weekend). The article notes that "the introduction of Netflix streaming services in 2007 is associated with a reduction of 14-17% in domestic box office revenues."
Summary: This article creates the claim that "the use of analytics in the film industry to predict success or attempt to produce 'box office hits' is different than using past intuition about movies; it is different than following a set formula or plan that has appeared to have worked in the past. Rather, analytics in movies, as in any other industry is about finding useful patterns in the data that are not visible to the naked eye and can be exploited for gain" (Schlesinger). This source includes analysis by genre.
Data